Click here for a 30-minute hands-on video introduction to Ethica. Click here to see my youtube playlist with videos from our 2017 Ethica Health bootcamp (Sponsor: Sax Institute, Sydney AU). Videos from our 2016 bootcamp may also be of interest.
Notice: Registration is now open for the 2019 Bootcamp & Incubator on Understanding Health Behavior using Smartphones and Wearables: Visitors interested in the materials available here may also be interested in knowing about for the coming 2019 Bootcamp & Incubator on Understanding Health Behavior using Smartphones and Wearables. The bootcamp will be held June 24-26, 2019 at the University of Saskatchewan and will incorporate both systematic and hands-on coverage of a wide variety of topics in smartphone-based data collection (and use of data from associated wearables); participants will receive hands-on assistance in building studies customized to their their research interests, bringing such studies from conceptualization to the analysis phase with cutting edge technologies. Click here to Register
Click here for brief sketches of how Ethica/iEpi can offer insight in different health subdomains.
While large volumes of epidemiological surveillance data are collected by public health authorities and researchers, such data suffers from some shortcomings. Collection of most information relies on individual self-reporting, which can be notoriously unreliable. Physically measured information (such as that collected by NHANES III, the Canadian Health Measures Survey and some other surveys) is traditionally costly and burdensome to acquire.
The rise of sensor-bearing smartphones offers the potential for enabling data collection from ubiquitous epidemiological sensing applications downloaded and run by volunteers -- all the while cross-linking this data to results from questionnaires delivered on the same devices, either at randomly selected times (as in classical ecological momentary assessments [EMAs]) or triggered by context.
Ethica is a 3rd generation health monitoring system for smartphones (iPhones & Android) and wearables. Ethica is designed to automatically record and cross-link a wide variety of minute-level resolution sensor data from the smartphone, from external sensors, data from study-specific on-device surveys (ecological momentary assessments [EMAs]) issued by the app, and crowdsourced data triggered (e.g., via button press) by the respondent. Ethica EMAs can contain a variety of types of questions as well as camera input (e.g., for dietary intake, medication dosage, test results, message exposure), and can be optionally triggered by context or user request (e.g., pressing a button indicating eating, administration of medication, occurrence of specific type of ideation or symptom). Reflecting the benefits of having an interface customized to each particular contexts, Ethica supports a highly reconfigurable interface, so that its functioning can be closely tailored to particular needs of the client. Moreover, Ethica can be easily adapted without programming to change the volume and type of sensor and survey data collected both between and adaptively within deployments. In addition to measuring sensor data from smartphones, Ethica now further supports a broad and growing set of wearable devices.
iEpi/Ethica has been used for over 100 studies worldwide, and is available in 6 languages. iEpi/Ethica has been deployed in support of health research in a wide number of geographic regions and socio-demographic contexts across North America, Europe, and Australia, including -- but not limited to -- projects at University of Michigan [multiple studies], Columbia University, Harvard School of Public Health [multiple studies], Drexel University, University of North Carolina, San Francisco State University, University of Western Sydney [multiple studies], Baylor College of Medicine, University of Loughborough, University of Regina [multiple studies], Wilfred Laurier University, Columbia University, University of New Mexico, University of Calgary, Memorial University, Boston University, Universite de Montreal, and Universita Della Svizzera Italiana [Lugano]. It has enjoyed several deployments to study infectious disease dynamics using microcontact data (including person-place and person-person transmission), and as part of a CDC-funded Randomized Control Trial, and is currently being deployed for a larger-scale trial project for a large US-based basic income study. Additional funded projects have focused on applying the system to better explicate the multi-factorial impact of highly trained service dogs on outcomes for veterans with PTSD, to elucidate the interaction between e-cigarettes and traditional tobacco products, to collect context-informed patient-reported outcomes for COPD, to enhance knowledge of antecedents and triggers of suicidal ideation amongst in-ward psychiatry patients and (separately) those in the community, to elevate understanding of community food procurement patterns, to assess the accuracy of traditional and smartphone based methods for tracking foodborne illness spread, assess the accuracy of traditional and smartphone based methods for tracking foodborne illness spread, understand mental health challenges in communities in Canada’s north. Ethica has enjoyed successful deployment in many university populations, in a variety of lower-income communities, in both high-density urban and rural regions, and for work ranging from institutional through to broader epidemiological studies, varying widely in scale from dozens to thousands of participants.
Common information that can be collected by Ethica/iEpi's sensors include information on participant location (with GPS), physical activity level (using accelerometers), sedentary behavior (using phone orientation and accelerometers), dietary intake (using the phone's camera), and inter-participant proximity/social networks (via Bluetooth), aspects of vehicular context, etc. In some deployments, system has also been adapted to collect data from external devices, such as weight scales. All such data can be automatically cross-linked to survey data collected via the app from the same respondent, which can be triggered by data picked up by the sensors (e.g., based on participant location, social context, or physical activity) or by or by participant action (e.g., taking an image of a meal, testing blood sugars or medication use).
While the data collected by the smartphone app side of Ethica/iEpi is typically streamed off of the devices for external analysis, the app is designed from the ground up to be highly secure as well as robust in the absence of connectivity. To ensure confidentiality, data is stored on the phone in an encrypted fashion. Transparently and invisibly to the user, data collected by Ethica/iEpi is opportunistically uploaded in encrypted form as the participant comes in contact with cell-phone and WiFi based networks.
Ethica/iEpi has been deployed in support of health research in a number of geographic regions and socio-demographic contexts across North America. Applicants have successfully employed Ethica/iEpi in diverse studies lasting 1-4 months. Ethica/iEpi has enjoyed successful deployment many university populations, in several lower-income communities, in both high-density urban and rural regions, and for work ranging from institutional through to broader epidemiological studies, varying widely in scale. When paired with transmission models, the system has successfully supported new insights on contagious disease spread and social determinants of health.
In what way could Ethica/iEpi help advance the research objectives of health research? There are diverse areas possible contribution, but we highlight two here. 1) Assessing symptomology (both clinical and subclinical) on a 24x7 basis, and assessing its temporal relationship to risk factors and exposures recorded by sensors (e.g., physical activity, pose, some social context, location) or EMAs (medication compliance, self-reported stressors, second-hand smoke exposure, dietary intake, other aspects of social context). 2) Use of such monitoring to enhance the speed, reliability, and depth of learning from implemented interventions. More specifically, when an intervention succeeds or fails, because of limitations on traditional measurements instruments (e.g., their limited accuracy in measuring changes in medication compliance, physical activity, dietary behavior, socialization and mixing patterns, mobility, communicational behavior), there is often limited understanding of the specific pathways of effect by which such success was realized or thwarted. A tool such as Ethica/iEpi is designed to inform an accurate understanding of the particular pathways by which an intervention affects important outcome measures (e.g., frequency and intensity of pain associated with osteoarthritis). Regardless of whether an intervention is successful or not in the end, the learning from it can be much deeper, more reliable and quicker by virtue of being able to examine which and by how much and how soon different pathways were affected (e.g., allowing observers to distinguish pathways that were successfully nudged vs. pathways that became a bottleneck and thereby stymied change in the outcomes of interest, or particular pathways that exerted disproportionate impact for interventions that did have effect.) Regardless of the success of the original intervention, securing such understanding from it can be of great value in devising more reliable interventions.
We see our Ethica/iEpi system as a natural complement to our computational models; the two work together to yield very powerful decision-making tools. Data from Ethica/iEpi helps to ground our models with a profusion of detailed, longitudinal data at the individual level. Various types of modeling we apply -- agent-based and aggregate simulation models, as well as inferential and statistical models -- help to "make sense" of this data, and to relate it to the choices that need to be made. In order to ground models in incoming data, we secure particularly pronounced benefit by combining dynamic models with machine-learning tools such as sequential Monte Carlo methods (particle filtering) and Particle MCMC methods.
The machine learning/computational statistics based sequential Monte Carlo technique of Particle Filtering allows for a model that learns as new data becomes available, by recurrently regrounding estimates in the model against observed data. This provides strong support for probabilistically estimating the current state of the system (e.g., people in different points in the health continuum), (probabilistically) projecting forward, and probabilistic assessment of intervention tradeoffs. We can think of Particle Filtering as providing value in many ways: 1) As a means of avoiding “blind” models, by allowing models to be brought back in line with observed conditions, rather than diverging increasingly from the observed world. 2) As a means of integrating a theory (in the form of a model) and one or more empirical time series to provide a an integrated, “tomographic” multi-dimensional picture of the state of the system. 3) As a way of learning from data as it arrives, sharpening our understanding of both the state of the system and the evolution of uncertain parameters (or, with MCMC, static parameter values).
Those interested in more concrete discussion about textured application of iEpiEthica/iEpiand similar smartphone technologies to different specific subdomains of health may find the this document of interest. The document discusses the use of Ethica/iEpi -- and, by extension, similar smartphone-based sensing, EMA and crowdsourcing systems -- to the Obesity, Chronic Disease, Tobacco-Related Disease, Communicable Disease, Mental Health, Environmental Epidemiology, and Health Services research areas.
The latest version of Ethica/iEpi is used centrally in our laboratory, but also being offered commercially through Ethica Data Systems. To get a feel for the system, we encourage signing up here for a free trial. Sample studies, instruments and demonstration data are available in the areas of physical activity/weight/built environment, waterborne illness, foodborne illness, communicable illness, air quality and zoonoses (Lyme's Disease, and West Nile virus).
For further information, please see the following streaming videos:
First glimpse of ethica interface presentation at Combining Data Science and Systems Science (Big Data and Dynamic Modeling) for Health.
Ethica Geographic Heat Map and Kibana and Survey Responses presentation at Combining Data Science and Systems Science (Big Data and Dynamic Modeling) for Health
Big Data and Dynamic Modeling presentation at Deakin Modeling and Chronic Disease Master Class 2015 (sponsored by Sax Institute and Deakin University).
My presentation from the Institute for Systems Science and Health 2011 demonstrates how we can leaverage such data using 3 systems science modeling techniques.
Presentation delivered at the 2012 Annual Meeting for the Society for Epidemiological Research focuses on how sensing can inform the design of rich simulation models, but also comments on the synergy between sensing and dynamic models.
Some example images produced from iEpi data are shown below.
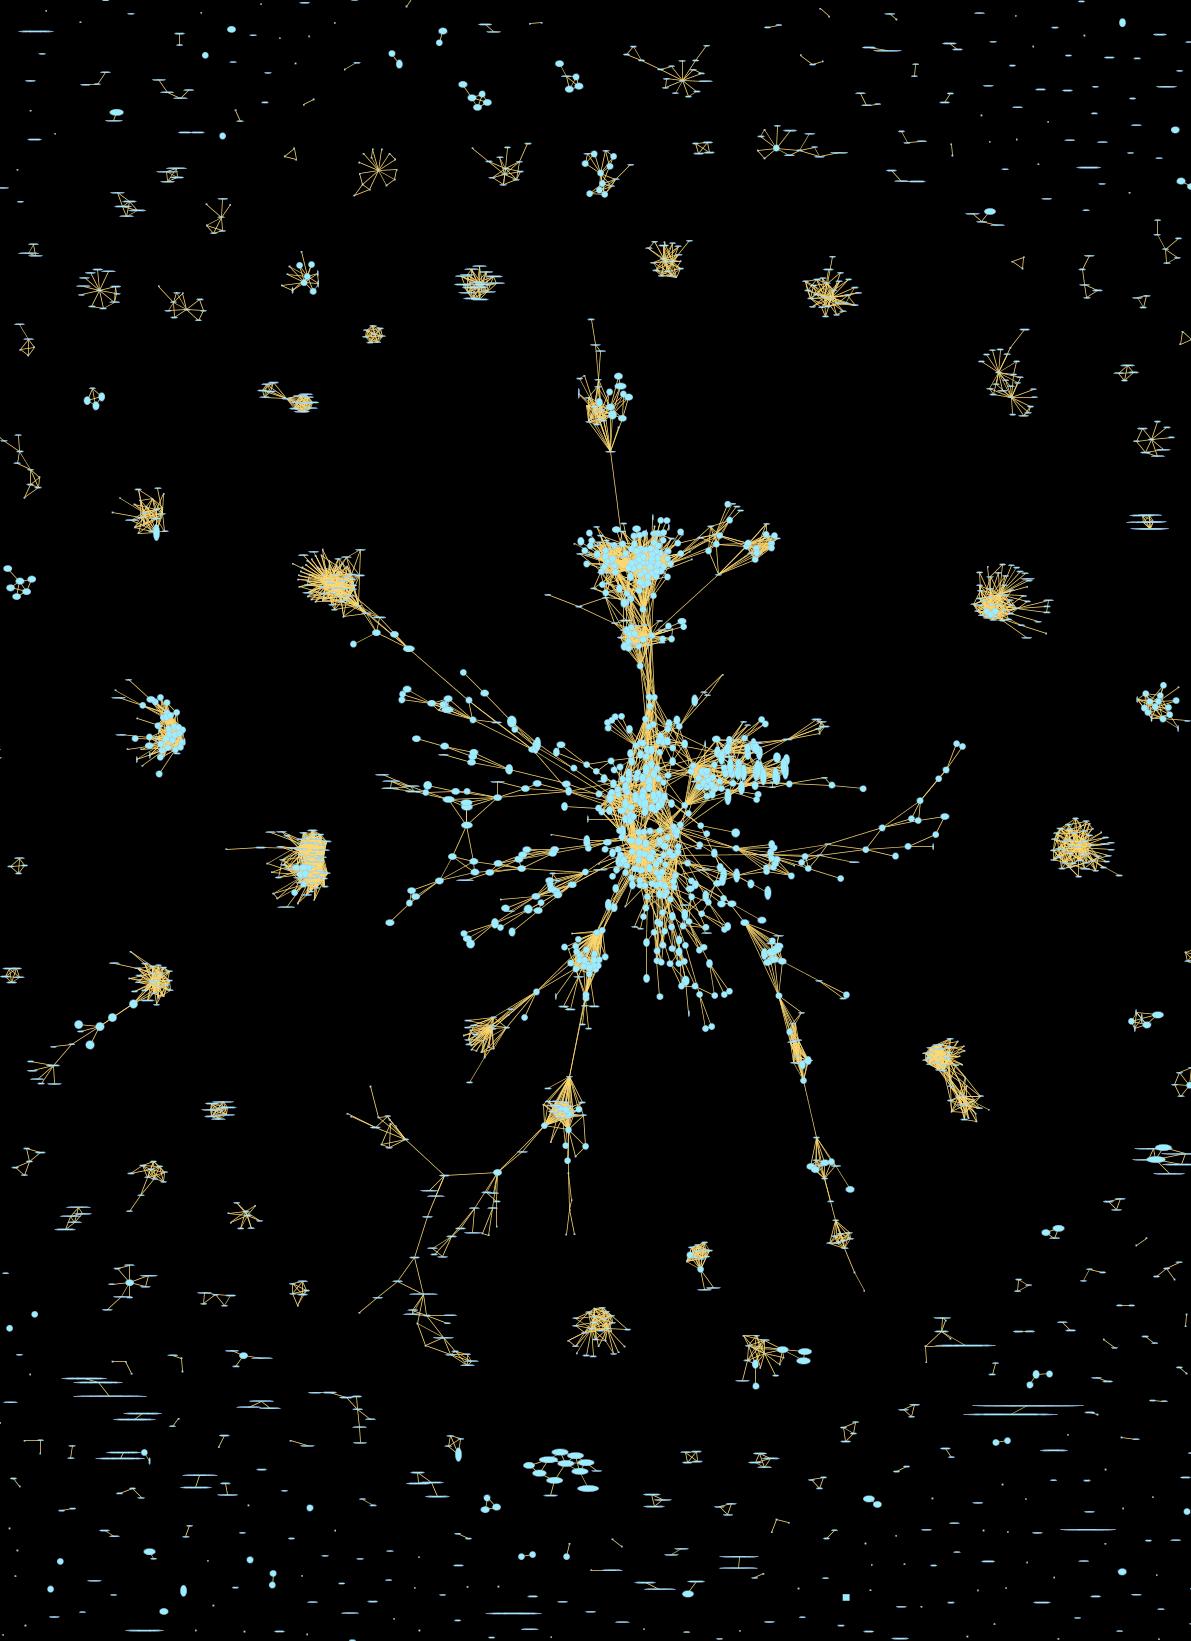
Within the diagram below, nodes are wifi locations. Two wifi nodes are considered connected if at least one participant detected them in the same 5-minute timeslot with a requisite signal strength. The nodes are shown with independent horizontal and vertical spans. The length of the horizontal axis for a node varies in proportion to the density of nonparticipants (people per unit time) detected at that node. The length of the vertical axis of a node is proportional to the density of participants detected at that node.
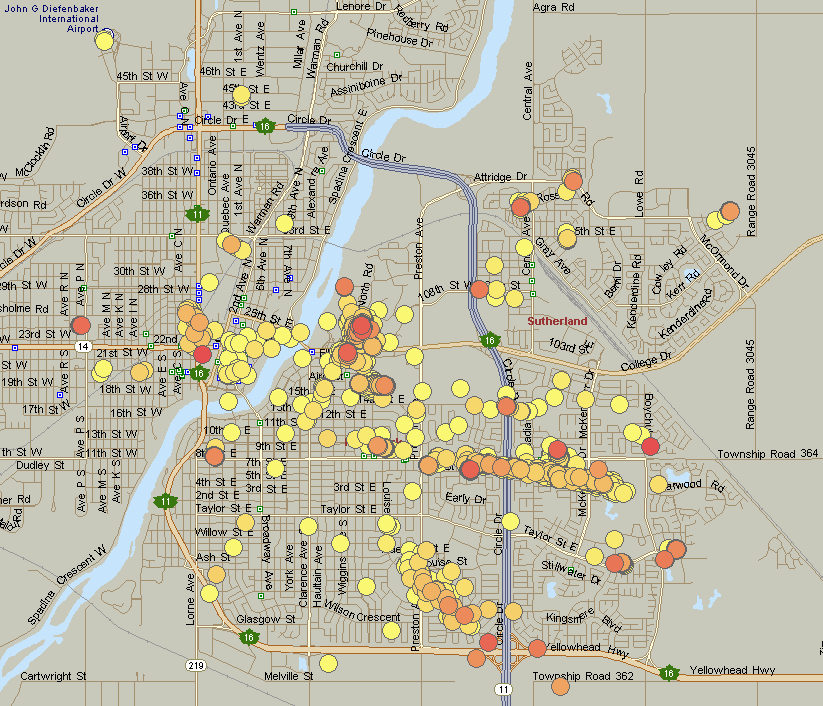
The following diagram depicts likelihood of infection in different locations in Saskatoon, as judged by a transmission model for a hypothetical influenza-like illness.
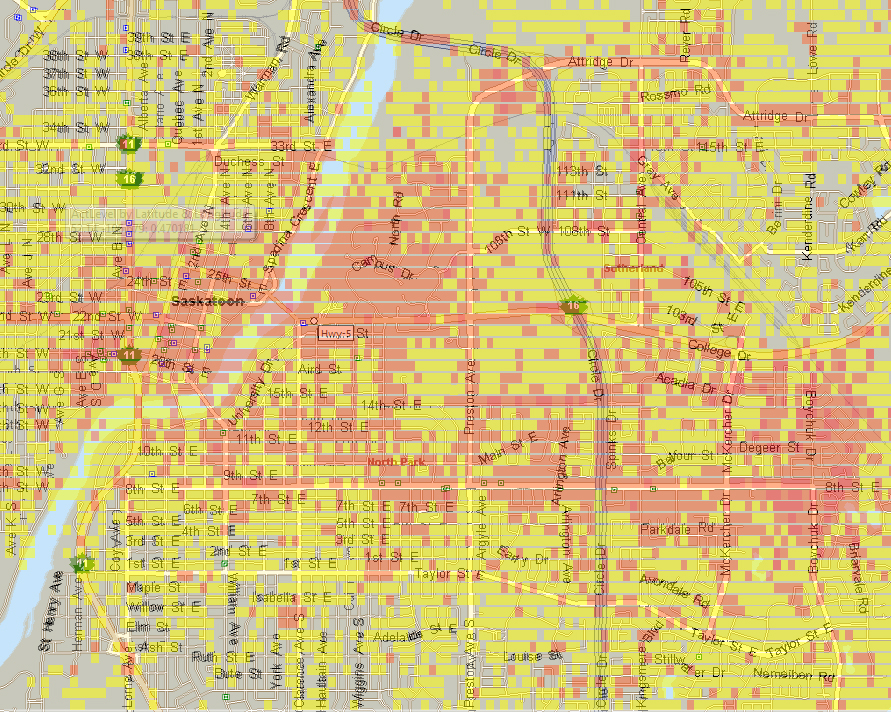
In the diagram below, a rough proxy for physical activity (based on accelerometer readings from participants' cellphones) were used to estimate levels of physical acitivity observed throughout Saskatoon over a one-month period.
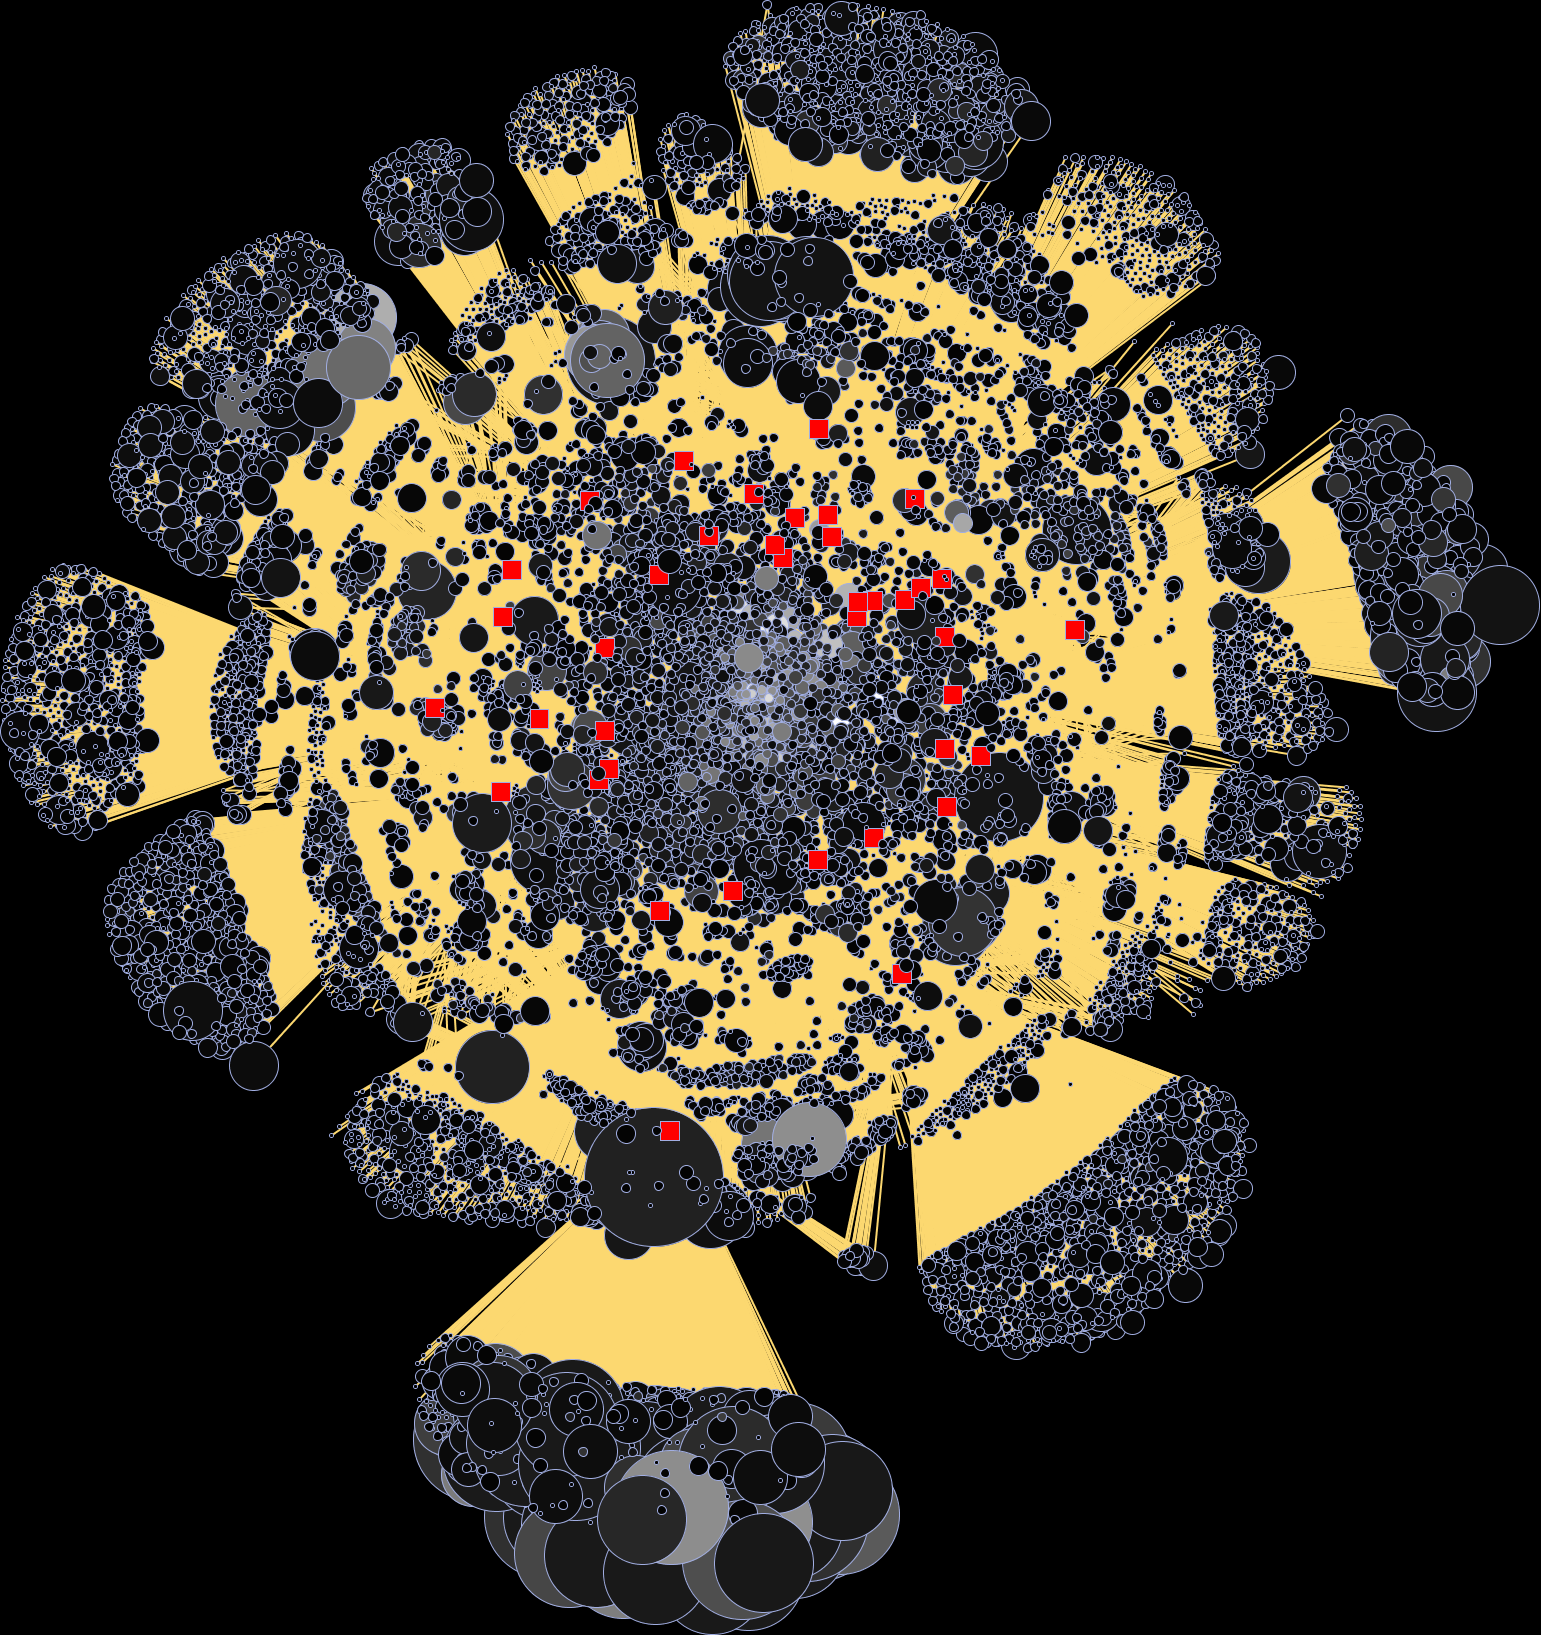
The below depicts wifi locations by non-participant time density (size) and count of distinct non-participants seen at location (brightness). Lines show association between a participant and particular locations at which they were present.
 and count of distinct non-participants seen at location (brightness).png)
Wifi locations here are shown as circles, each with area proportional to non-participant density. Brightness indicates count of discint non-participants seen at a location. Participants are shown in red, with connections to the locations with which they were associated.