Effects of Awareness Support on Groupware Usability
Carl Gutwin Department of Computer Science |
Saul Greenberg Department of Computer Science |
- Cite as:
- Gutwin, C. and Greenberg, S (1998). Effects of Awareness Support on Groupware Usability. Proceedings of the CHI'98 Conference on Human Factors in Computing Systems, ACM Press.
Abstract
Collaboration in current real-time groupware systems is often an awkward and clumsy process. We hypothesize that better support for workspace awareness can improve the usability of these shared computational workspaces. We conducted an experiment that compared people’s performance on two versions of a groupware interface. The interfaces used workspace miniatures to provide different levels of support for workspace awareness. The basic miniature showed information only about the local user, and the enhanced miniature showed the location and activity of others in the workspace as well. In two of three task types tested, completion times were lower with increased awareness support, and in one task type, communication was more efficient. Participants also greatly preferred the awareness-enhanced system. The study provides empirical evidence of, and underlying reasons for, the value of supporting workspace awareness in groupware.
Keywords: workspace awareness, groupware, usability
1. Introduction
Real-time distributed groupware allows people to work together at the same time from different places. Many of these systems provide shared computational workspaces—two-dimensional areas akin to whiteboards or tabletops—where people can create and manipulate task artifacts. Although many of the technical problems of constructing these systems have been solved, their usability problems have not yet been eliminated. Collaboration in groupware workspaces is often awkward, stilted, and frustrating compared to face-to-face settings. The difficulty is particularly acute when the workspace is larger than the screen and people navigate independently through the workspace (called relaxed-WYSIWIS view sharing [12]).
Part of the problem with current systems is that they don’t provide much information about other participants in the session. When people work together in a face-to-face setting, a wide variety of perceptual cues help them keep track of what others are doing. This awareness of others in the workspace is workspace awareness, the up–to–the–moment understanding of another person’s interaction with the shared space [7,8]. At a simple level, it involves knowledge of who is present, where they are working, and what they are doing. Workspace awareness is used in collaboration to coordinate activity, to simplify verbal communication, to provide appropriate assistance, and to manage movement between individual and shared work. Current groupware systems provide only a fraction of the information needed to maintain workspace awareness. They lack many of the natural affordances that exist in face-to-face settings, and they rarely provide artificial support.
We believe that increased support for workspace awareness will improve the usability of groupware. A previous study provided qualitative evidence that awareness support is valuable [5]. It also showed that workspace miniatures—miniature representations of the entire workspace—are useful vehicles for this information. In this experiment we are interested in the quantitative effects of awareness support on groupware usability. We compare two groupware interfaces that provide different amounts of awareness information through their workspace miniatures. In particular, we compare a basic miniature to one that adds three kinds of information:
- the location of others’ viewports in the workspace;
- the location and motion of people’s cursors; and
- the motion of workspace objects as they are moved.
The awareness-enhanced version of the miniature is called the radar view [6]. The experiment measures three aspects of groupware usability: how well groups perform with each interface, the efficiency of their collaboration, and the group’s satisfaction with the system.
The adaptability and resourcefulness of groups makes groupware difficult to evaluate [4,10]. Nevertheless, we believe that support for awareness will make substantial differences to usability, because of the importance of the workspace in collaborative interaction. The workspace is an external representation of a joint activity, and a stage on which the collaboration is acted out. Previous investigations have recognized that a shared workspace and the artifacts in it change the way people communicate through actions, speech, and gesture [1,3,14,15]. Workspace awareness is one of the keys that allows people to interact in and through the shared workspace. This study takes initial steps towards an empirical understanding of the role played by workspace awareness, and how to support it in groupware.
2. Methods and Procedures
The study’s basic question asks whether information about another person’s location and activity in the visual workspace will help groups complete tasks. In particular, we compared people’s performance, perception of effort, and verbal efficiency for two interfaces that provided different levels of awareness support. Both interfaces used workspace miniatures, but the basic overview only showed information about the local participant, whereas the enhanced radar view added information about the location and activity of others in the workspace. Groups completed three kinds of tasks to give us a broad perspective on awareness in collaborative situations. Groups also worked with both interfaces, and were asked which they preferred.
2.1 Groupware System and Interface Conditions
A direct-manipulation groupware application was built for the experiment, using the GroupKit groupware toolkit [11]. The application is a pipeline construction kit that allows the assembly and manipulation of simple pipeline networks in a shared two-dimensional workspace (Figure 1). Users can create, move, and rotate sections of pipe, and can join or split sections using a welding tool. The workspace is rectangular, and four times larger than the computer screen in each direction. Users scroll around the workspace by dragging their cursor past the window border.
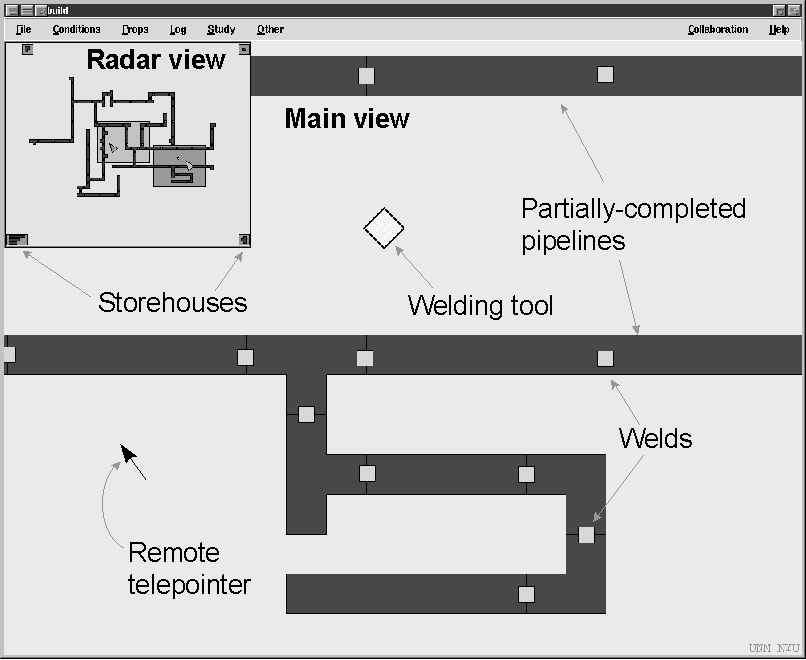
Figure 1. The pipeline system (radar view version)
The pipeline system’s interface consists of two windows. The main view takes up most of the screen and shows objects in full size and detail. The main view allows users to manipulate objects and to scroll to other areas of the workspace. People create pipelines by dragging pipe sections from storehouses in the corners of the workspace, aligning the sections, and then welding them together by dropping a diamond-shaped welding tool onto the joint. Welds are marked by a yellow square, and once pieces are welded, they move as a unit.
The second window is one of two miniature views, the radar view or the overview. This view is inset into the top left corner of the main view, and shows the entire workspace in miniature. The radar view and the overview differed in three ways, as compared in Figure 2.
- The radar showed workspace objects as they moved; the overview was only updated after the move was complete.
- The radar showed people’s viewports (the area of the workspace visible in each person’s main view) and the overview showed only the local user’s viewport.
- The radar showed miniature telepointers for both users, and the overview did not show any telepointers.
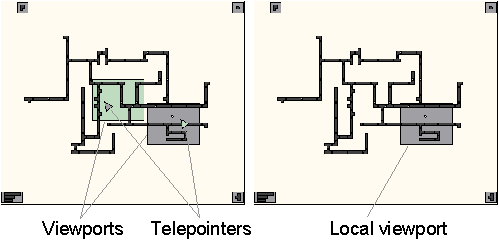
Figure 2. Radar view (left) and Overview (right).
In sum, the two conditions differed only in the awareness information presented in the miniature. The overview only showed information about the local user, and the radar showed where the other person was located, showed their pointer, and showed moves as they occurred.
2.2 Tasks
Participants completed three kinds of tasks. Tasks were designed to mimic episodes and activities that we observed in face-to-face collaboration, but were constrained to meet three criteria. First, we wanted tasks that required people to move independently around the workspace. Second, we wanted tasks that used location or activity information. Third, we wanted realistic tasks that were likely to occur in a wide variety of workspace activities. Division of responsibility in the tasks was similar to Chapanis’ communication studies, where the source has information that the seeker needs to do their part of the task [2].
The follow task asked participants to make ten specific welds on an existing pipe network. One person, the joiner, was given a paper map showing the locations to be welded, and had to prepare the pipe sections at each place. The other person was the welder, and would follow the joiner to each location and weld the pipe. Since the welder had no map, the joiner was also responsible for ensuring that the welder went to the correct location.
The copy task asked participants to construct two identical structures from two existing stockpiles of pipe sections. The stockpiles were located at opposite ends of the workspace. One person, the leader, had a paper picture of what was to be built, and used this to find the next piece in their stockpile. The other person, the copier, did not have the picture, and so had to copy the leader’s actions. The leader was responsible for making sure that the copier knew which piece to take next and where to place it.
The direct task asked one participant to verbally guide the other through adding six specific pipe sections to an existing network. The director had a map showing which pieces were to be added, and where they were to be added, but was not allowed to move around in the workspace. The actor did the work, following the director’s instructions. The director did not see their main view during this task, so the only visual feedback that they received of the actor’s progress was from the miniature view.
2.3 Study Design
The study combines two independent variables in a two-way mixed factorial design: View is a between-subjects factor; Task is a repeated-measures factor. Our hypothesis is that additional awareness information will improve people’s speed, efficiency, and satisfaction with a groupware system. The hypothesis is tested by looking for effects of View in interaction with Task. Differences between tasks are expected, since the different task types are not related. Three dependent variables—completion time, perceived effort, and communication efficiency—are measured within each cell of the diagram in Table 1.
Task:
Follow
Copy
Direct
View: Radar view
G 1-10
G 1-10
G 1-10
Overview
G 11-20
G 11-20
G 11-20
Table 1. Diagram of study design (G = Group).
In addition to the between-subjects comparison, we wanted to gather preference data; therefore, participants used both the radar and overview interfaces. After finishing the first three tasks, groups were asked to complete a second set of tasks using the other interface. They then chose which interface they preferred. The same three measures were taken for the second set of tasks, so that exploratory within-subjects analyses could be carried out as well.
2.4 Participants
Undergraduate and graduate students experienced with mouse-and-window-based applications were recruited from the University of Calgary, and were paid $10 for taking part. Forty people participated in the study, 30 men and 10 women. Participants were assigned a partner for the study, either choosing one themselves or by random assignment. Sex pairings were equalized across the two conditions.
2.5 Procedure
The experiment was carried out in several stages. Participants were first asked to sign consent forms and fill out a short demographic questionnaire, and then were introduced to the situation and the system’s functions using standardized instructions. Pairs were randomly assigned to either the radar or the overview condition, and the specifics of their miniature view were explained. Participants were then allowed to practice with the system until they could each perform a basic set of simple operations such as scrolling, drag-scrolling, welding, and unwelding. They then completed a practice task.
Pairs then completed six test tasks: three with one kind of view (radar or overview), and then three with the other. The order of the tasks was counterbalanced across groups. For each task, the experimenter gave standard instructions, then started the pair on the task. After each task, the pair filled out a questionnaire. At the end of the session, participants were asked which system they preferred. A short interview was then conducted to follow up episodes observed during the session or particular questionnaire responses.
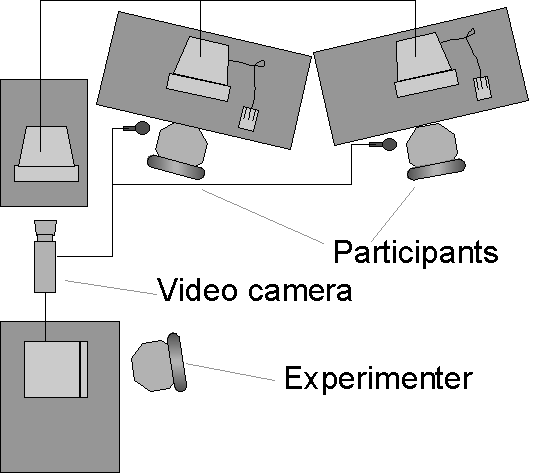
Figure 3. Experiment room setup
2.6 Physical setup
Participants worked at two workstations, angled so that they could not see each others’ screens, but so that they could see and talk to one another.
The experimenter sat at a recording station at the back of the room. The actions of both participants were transmitted to a third computer that showed a composite of the workspace. This computer’s screen and both voices were recorded on videotape.
3. Results
3.1 Completion Time
Our hypothesis predicts that people will be able to complete tasks more quickly with more awareness information. Completion times for the first three tasks are summarized in Figure 4; error bars represent standard deviation.

Figure 4. Mean completion times for tasks 1-3 (in minutes)
We compared the independent variables Task and View using two-way analysis of variance (ANOVA). There was an interaction between Task and View (F = 7.772, p < 0.05). Posthoc comparisons of radar and overview completion times were carried out for each task type using one-tailed t-tests. To maintain alpha below 0.05, only those effects with p < 0.0167 were considered significant. Of the three tasks, differences in Follow (t = 2.48, p<0.0167) and Direct (t = 3.05, p<0.0167) were significant.
3.2 Communication Efficiency
Verbal interaction was recorded and transcribed. Communication efficiency was measured by counting the number of words used to give directions to the other person (in the Follow and Direct tasks), and the number of words used to indicate pieces (in the Copy task). Two assistants each coded half the transcripts and counted the direction and indication words. On a test set of four transcripts, inter-rater agreement between the two coder’s counts (using Pearson’s r) was above 80% for all three tasks. Posthoc t-tests showed a significant difference for the Follow task (t = 4.34, p < 0.0167); no differences were found for the Copy or Direct tasks.
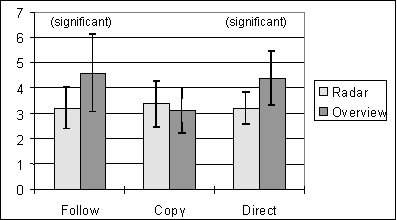
Figure 5. Mean verbal efficiency (in number of words)
3.3 Perceived Effort
Perception of effort was measured by a repeated questionnaire given after each task. The questionnaire looked at four aspects of how hard a task was: (1) overall difficulty, (2) effort required, (3) concentration required, and (4) difficulty discussing the task. Questions used five-point scales with semantic anchors. Responses were translated to interval scores, using 1 to represent least effort and 5 to represent most effort. Figure 6 summarizes mean responses for each question in each task. Lines connecting the points are intended only to visually differentiate the two conditions, not to imply connections between questions.
Posthoc one-tailed t-tests were used to compare radar to overview on each question, this time dividing alpha of 0.05 between the 12 tests. None of the analyses showed significant differences.
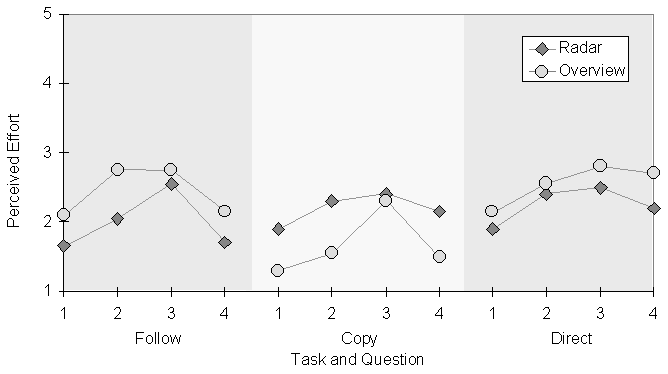
Figure 6. Mean questionnaire responses for Tasks 1-3
3.4 Within-Subjects Exploratory Results
Completion times and questionnaire results were also gathered for the second trio of tasks, those completed with the group’s alternate interface. These measures allowed us to consider the question of what happens when a group moves from one view type to the other. We assume that all groups will perform better in the second set of tasks because of practice, but we wondered whether the improvement would be greater when going from the radar view to the overview, or when going from the overview to the radar view.
Figure 7 shows changes in completion time between the first and second attempts at each task. For all task types, groups were faster if they used the overview and then the radar; if they used the radar and then the overview, only the Copy task was faster in the second attempt.
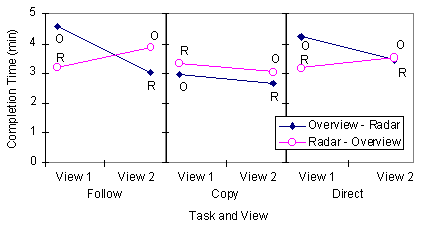
Figure 7. Mean changes in completion time between first and second attempts at a task.
A similar analysis was done with questionnaire responses. Figure 8 shows differentials in perceived effort—that is, the second response to a question minus the first response. When groups used the radar and then the overview, they felt that the second task was more difficult than the first; when they used the overview and then the radar, they felt that the second task was easier. Again, the lines in Figure 8 are intended only to differentiate the two conditions.
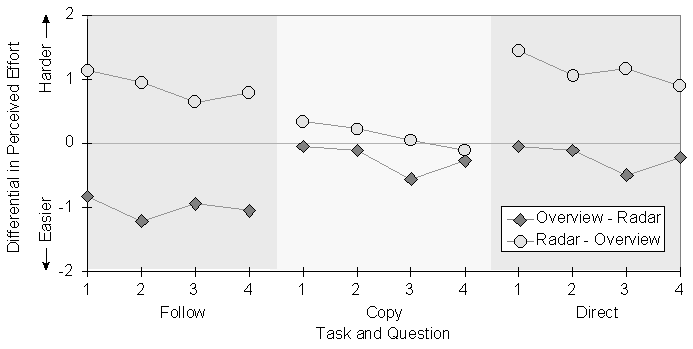
Points below the line indicate that the second task was perceived to be easier than the first.
3.5 Overall Preference
After all tasks were completed and pairs had used both interfaces, participants were asked three questions about which system they preferred. The questions asked which system better supported collaborative work, which system was easier to use for group tasks, and which system the participant preferred overall. Almost all of the participants who responded chose the radar view, as shown in Table 2.
Which system: Radar
Overview
1. …better supported collaboration 35
3
2. …was easier for group work 38
0
3. …did you prefer overall 38
0
Table 2. Number of participants preferring each interface
Chi-square analysis showed in each case that the number of participants choosing the radar view was significantly higher than the expected number: for question 1, c 2 = 26.95, p<0.0167; for question 2, c 2 = 38.0, p<0.0167; for question 3, c 2 = 38.0, p<0.0167.
3.6 Summary of ResultsA variety of results were obtained, some showing improvement when there was additional awareness information, and some showing no difference between the two displays. When using the radar view, groups finished the Follow and Direct tasks significantly faster, and used significantly fewer words in the Follow task. The within-subjects measures appear to reinforce these findings, and participants overwhelmingly preferred the radar view when they had seen both interfaces. However, no differences were found in perceived effort for any of the tasks, and no differences were found on any measure for the Copy task.
4 Discussion
The two versions of the interface differed only in that the radar view provided visual indications of the other person’s location, the location of their cursor, and the motion of objects that they moved. The significant differences between these two very similar interfaces clearly suggests that the additional awareness information helped people complete some tasks more quickly and more efficiently. We interpret and explain our findings below. First, we consider two reasons why the additions to the radar view were successful: that they allow visual communication, and that they provide continuous feedback. Second, we examine the measures of perceived effort, and consider why the Copy task was not affected by the view type.
4.1 Visual vs. Verbal Communication
Visual indication of the other person’s location and activity in the radar view helped people to complete the Weld and Direct tasks more quickly. One way that it did so was by allowing people to use different and more effective strategies to carry out the task. Although we did not specifically analyze strategy, the video record clearly shows that different strategies were prevalent in each condition.
In the Follow task, there were two main strategies used. When pairs used the overview, they generally used a "describe" strategy. The joiner (the person with the map) had to describe the workspace location to the welder (who had no map) and verbally guide them to the right place. Since the structures in the workspace were not particularly easy to describe, the joiner had to be careful in planning and delivering her utterances. Even so, the descriptions were often fairly complicated:
J: The second weld is near the bottom in the middle section, there’s two pieces of pipe, ok, there’s two longer pieces of pipe, ok, there’s, umm, right in the middle, right on top of the lowermost piece of pipe, in the middle there, there’s two welds that need to be done.
F: Uh, ok…
With the radar view, people could use a "follow-me" strategy: the welder could find the right location simply by following the joiner’s view rectangle. The visual indication of the joiner’s location transformed the task from a series of complicated verbal exchanges to a relatively simple perceptual task of aligning rectangles on the screen.
This transformation also explains why groups used fewer words in the Follow task when they used the radar view. Groups using the "follow-me" strategy had the necessary location information available in the radar, and so they did not need to communicate locations verbally. Joiners would often make general statements about the location of the next weld, but they would let the radar supply the specifics:
J: ok, we’re going over to the left…that’s getting welded
J: OK, now, way over here…ok, that needs to be welded
J: OK, and just over left, same height, weld this together…
The overview did actually show the other person’s location whenever they dropped a piece of pipe or the welding tool, and so did allow a limited kind of visual communication (the "here-I-am" strategy). However, this technique was hard to detect in the overview and clumsy for the welder, and only a few groups were able to use it effectively.
In the Direct task, the director was not active in the workspace, so radar users could not employ the "follow-me" strategy. Even though the director in both conditions had to provide verbal descriptions of location, the information in the radar view allowed them to use different kinds of descriptions. With the overview, directors had to describe a specific destination to the actor, and like the Follow task, these descriptions were not easy to construct:
D: ok, near the very bottom you’ll notice that there’s a vertical line right in the middle in the bottom of the pipeline, ok there is a T, a T, under that corner piece…
With the radar view, however, directors could see where the actor was located, and could give them relative directions (up, down, right, left) that were much easier to construct and much less prone to misinterpretation. For example:
D: ok, move to the left, stop, stop. Move up, move straight up, move straight up, stop. Go a little bit to the left, stop, stop. Ok, now you see there are two T sections…
The use of descriptive or relative directions can also partly explain why the radar did not lead to fewer words spoken in the Direct task (see Figure 5). Even though these two methods of giving directions differ greatly, nothing about giving relative directions implies that fewer words will be needed. For example, the first of the two utterances above might be harder to plan and to understand, but the utterances contain the same number of words. Therefore, word counts may be an insufficient measure of verbal efficiency; other metrics like utterance length or vocabulary size may have been more appropriate.
In summary, the location information presented in the radar view allowed people to communicate required information visually in the Follow and Direct tasks. The visual information allowed different strategies for carrying out the tasks, and allowed simplification of verbal utterances.
4.2 Continuous Feedback
The radar view provided continuous feedback about location and piece position, feedback that allowed groups to complete the Follow and Direct tasks more quickly. In particular, this feedback gave people visual evidence of understanding [1], which was more effective and less error-prone than verbal evidence.
In the Direct task, the director guides the actor’s movement by giving her an instruction. With each instruction, the director requires evidence that he has succeeded in conveying the correct meaning to the actor, and that the actor has successfully moved where she is supposed to go. In addition, the director cannot give the next instruction until he knows that the actor has successfully completed the current one. The information differences between the radar view and the overview provide different kinds of evidence, and afford different means for establishing that instructions have been understood and carried out.
The overview lets the actor give evidence in two ways: verbal acknowledgment (e.g. "ok, I’m there") or the "here-I-am" strategy of dropping an object to indicate their location (e.g. "ok, can you see my piece?"). In both of these methods, the evidence is given at the end of an action: that is, the director gives the instruction, and the actor carries it out to the best of their ability before acknowledging. The problem with this form of interaction is that the director may give poor descriptions and the actor may go the wrong way. Providing evidence only at the end of the action means that time is wasted when the actor makes a mistake:
D: …go up to that part that’s jetting across the middle…
A: <moves>
A: <drops piece> this part right here?
D: Uh, on the left side actually, on the left side…
In addition, both the verbal and the "here-I-am" methods of acknowledgment have other drawbacks. If the actor believes that they have followed the instruction correctly, but really haven’t, they will mislead the director with their acknowledgment. The director has little chance to detect the error, and so may continue, piling error upon error. The "here-I-am" strategy at least gives the director concrete information about the actor’s location, but this information can be out of date. We observed actors drop objects, then pick them up and keep moving. The director, however, saw only the out-of-date picture of the dropped piece. If they assumed that the location of the piece was also the location of the actor, errors could ensue.
The awareness information in the radar provided different kinds of evidence. Verbal acknowledgment was still possible, but the radar also showed up-to-date object movement and viewport location. In the Direct task, these representations could be used as immediate visual evidence of the actor’s understanding and intentions. If the actor started moving the wrong way, the director would see the misunderstanding immediately:
D: ok, just above where you were working before…
A: <begins moving>
D: oh, not too far…yep, right…nope, up, up, up, higher, yeah, right there.
The availability of continuous evidence also made it possible for people to give continuous instructions. This is a strategy with far fewer verbal turns, and where the actor acknowledges implicitly through their actions. Clark summarizes the difference between verbal and visual acknowledgment for on-going "installment" utterances like instructions: "in installment utterances, speakers seek acknowledgments of understanding (e.g. ‘yeah’) after each installment and formulate the next installment contingent on that acknowledgment. With visual evidence, [the speaker] gets confirmation or disconfirmation while he is producing the current installment" ([3], p. 326).
Evidence of understanding and action in the radar was accurate, easy to get, and timely. The director was able to determine more quickly whether the instruction was going to succeed, and could reduce the cost of errors.
4.3 Perceived Effort
Measures of perceived effort in the between-subjects analysis showed no differences between the two conditions for any task. This runs contrary to both our expectations and our observations. We observed groups having more difficulty discussing the task, and making more errors, when they used the overview. It is possible that the questionnaire was a poor measure of effort. The main problem was that people had nothing to compare their experience to, and may have been unable to accurately indicate their effort on the scales given. This problem seems more likely considering that once participants had seen both interfaces, questionnaire responses showed greater differences (see Figure 8). The overwhelming preference for the interface with the added awareness information (see Table 2) also suggests that there were real differences in the experience of using the system, but that our measures were insensitive to these differences.
4.4 Explaining the Copy TaskThe Copy task showed no effects of View on any measure. There are several reasons why the additional awareness information did not improve performance or efficiency, and the most important of these again concerns strategy. Participants typically used one of two strategies to indicate the next piece to their partners: they could describe the piece verbally (describe-piece), or they could show it to them through the radar by dragging it (show-by-drag) or through the overview by dropping it (show-by-drop). Describing pieces was certainly the wordier strategy and was also slower.
One underlying reason for the lack of effect is that there were equivalent strategies in both the radar and overview conditions. The show-by-drag and show-by-drop strategies provide almost the same information to the person doing the copying. However, since show-by-drop is a less obvious strategy than show-by-drag, we had expected describe strategies to be more prevalent in the overview condition. However, this was not the case. Even though the radar view allowed people to point out pieces quite easily, the video record suggests that more groups used the describe-piece strategy in the radar condition than in the overview condition. In a few cases, choosing to describe rather than show pieces seemed to be the result of inexperience: during one session, the leader said "oh right—I keep forgetting that we can both see the same radar view," whereupon she switched from a describe to a show strategy.
The combination of an equivalent strategy in the overview condition and a greater use of description in the radar condition account for the lack of speed or efficiency differences between the two conditions for the Copy task.
5 Lessons for Groupware Designers
There are several lessons that groupware designers can take from this study. First, the findings reiterate the value of workspace miniatures, as suggested in our previous study [5]. In the present experiment, we regularly observed people using both the radar and the overview to orient themselves in the workspace, to navigate, to keep track of the current global state of the activity, and to carry out individual work that did not fit inside the main view. All shared-workspace groupware systems will benefit from a workspace miniature.
Second, the main finding of the study is that adding workspace awareness information to the miniature—visual indications of viewport location, cursor movement, and object movement—can significantly improve speed, efficiency, and satisfaction. These awareness components should be included in shared-workspace applications.
The tasks we examined are common to many kinds of collaboration, and we believe that support for workspace awareness will also benefit more realistic tasks. Specifically, in tasks where information about locations and activities is used, and where that information is difficult to provide verbally, the radar view will have a positive effect. However, the size of the effect on real-world tasks depends upon what portion of the task can benefit from visual information and continuous feedback. In Follow and Direct, the radar condition was faster by about 25%, a substantial margin. However, these controlled tasks constrained the activity. More realistic tasks will likely include a mix of different activities, some that will benefit from the awareness information, and some that will not. Although the information will still be useful for part of the task, differences will be harder to measure.
Third, the experience of the Copy task provides a cautionary note, and suggests that the benefits of the radar view do not automatically improve performance. Potential improvements are dependent upon the information requirements of the activity and on the ways that groups choose to carry out the task. Designers should carefully consider what information is available and consider the strategies that will be used to carry out the task.
6 Conclusion
In this paper, we considered the problem of groupware usability, and the hypothesis that interface support for workspace awareness can improve usability. We carried out an experiment to look at the effects of showing viewports, cursors, and object motion in a workspace miniature. For tasks that use information about location and activity, and where constructing verbal descriptions is difficult, the workspace awareness information in the radar can reduce completion time, improve communicative efficiency, and increase satisfaction.
The study adds quantitative evidence to the qualitative findings of the prior study [5], and begins to put intuitions about awareness onto an empirical footing. Our further research in this area will move in two directions. First, we will continue work on quantitative evaluations of groupware usability. Some of the questions that we were unable to explore in this experiment include the effects of awareness support in other kinds of tasks such as organization or creation, and how well the radar view works when there are more than two people in the group.
Second, we want to look more closely at the links between shared workspaces, communication, and collaborative interaction. Work in this direction will look more carefully at naturalistic situations and use methods like conversation analysis and interaction analysis [13]. We believe that the connection between communication and the environment can tell us a great deal about groupware usability and about the information requirements of the next generation of groupware systems.
Appendix: Measuring Groupware Usability
One of our broader research goals is to find effective methods and measures for evaluating groupware usability. Groupware systems are difficult to evaluate because groups are more variable and adaptable than individuals.
Performance measures are particularly problematic. Several previous studies have manipulated the interaction facilities available to a distributed group (e.g. [3,10]). These studies show that performance measures are "only sensitive to gross changes in the facilities available for communication" ([10], p. 125). The present study showed that awareness information can be one of these major changes. However, to detect differences between the conditions we still had to carefully constrain the tasks.
Questionnaire and transcript measures are less affected by adaptability, but have other problems. Questionnaires, as discussed earlier, may be more appropriate in situations where people are comparing interfaces or experiences rather than making absolute judgments. The transcript measures were extremely useful in showing us some of the subtleties of interaction during the tasks. However, transcribing and coding conversations is time-consuming and difficult. The fragmentary nature of dialogue in a shared workspace often makes categorization problematic. Furthermore, counting words is too broad a metric to detect some aspects of communicative complexity and efficiency.
Finally, our decision to explore multiple tasks and take multiple measures considerably enriched the study, although it complicated the analysis. Our intention was to look at the hypothesis from several different angles, and offset the drawbacks of individual methods [9]. Although this approach requires careful planning, it is a valuable way to look at the complex interactions in shared workspaces.
Acknowledgements. Thanks to Krista McIntosh and Jase Chugh for assistance in running the study and analyzing the results; to Ted O’Grady, Donald Cox, and Mark Roseman for comments; and to NSERC and Intel Corporation for financial support.
Software Availability. GroupKit and the pipeline system used in the study are freely available at www.cpsc.ucalgary.ca/projects/grouplab.
References
- Brennan, S. Seeking and Providing Evidence for Mutual Understanding, Unpublished Ph.D. thesis, Stanford University, Stanford, CA, 1990.
- Chapanis, A. Interactive Human Communication, Scientific American, 232, 1975, 36-42.
- Clark, H. Using Language. Cambridge: Cambridge University Press, 1996.
- Grudin, J. Groupware and Cooperative Work: Problems and Prospects, in The Art of Human-Computer Interface Design, B. Laurel ed., Addison-Wesley, Reading, Mass., 1990, 171-185.
- Gutwin, C., Roseman, M., and Greenberg, S. A Usability Study of Awareness Widgets in a Shared Workspace Groupware System. Proceedings of the Conference on Computer-Supported Cooperative Work (CSCW’96), Boston, 1996, 258-267.
- Gutwin, C. and Greenberg, S. Workspace Awareness Support with Radar Views. Conference companion of the Conference on Human Factors in Computing Systems (CHI’96), Vancouver, 1996, 210-211.
- Gutwin, C. and Greenberg, S. Workspace Awareness for Groupware. Conference companion of the Conference on Human Factors in Computing Systems (CHI’96), Vancouver, 1996, 208-209.
- Gutwin, C. Workspace Awareness in Real-Time Distributed Groupware. Unpublished Ph.D. dissertation, University of Calgary, Calgary, AB, 1997. Available at: www.cpsc.ucalgary.ca/~gutwin/dissertation/
- McGrath, J. Methodology Matters: Doing Research in the Behavioral and Social Sciences. Reprinted in R. Baecker, J. Grudin, W. Buxton, and S. Greenberg (eds.), Human-Computer Interaction: Towards the Year 2000, San Francisco, Morgan Kaufmann, 1995, 152-169.
- Monk, A., J. McCarthy, L. Watts, and O. Daly-Jones. Measures of Process, in CSCW Requirements and Evaluation, P. Thomas ed., Springer-Verlag, London, 1996, 125-139.
- Roseman, M. and Greenberg, S. (1996). Building Real Time Groupware with GroupKit, A Groupware Toolkit. Transactions on Computer-Human Interaction, 3(1), 66-106.
- Stefik, M., D. Bobrow, G. Foster, S. Lanning, and D. Tatar, WYSIWIS Revised: Early Experiences with Multiuser Interfaces, ACM Transactions on Office Information Systems, 5(2), 147-167, 1987.
- Suchman, L., and Trigg, R. Understanding Practice: Video as a Medium for Reflection and Design. In J Greenbaum and M. Kyng (eds.), Design at Work: Cooperative Design of Computer Systems, Hillsdale NJ, Lawrence Erlbaum, 1991, 65-89.
- Tang, J. Findings from Observational Studies of Collaborative Work, International Journal of Man-Machine Studies, 34(2), 1991, 143-160.
- Tatar, D., G. Foster, and D. Bobrow. Design for Conversation: Lessons from Cognoter, International Journal of Man-Machine Studies, 34(2), 1991, 185-210.
©Association for Computing Machinery, Inc (ACM).
Permission to make digital/hard copy of all or part of this material without fee is
granted provided that copies are not made or distributed for profit or commercial
advantage, the ACM copyright/server notice, the title of the publication and its date
appear, and notice is given that copyright is by permission of the Association for
Computing Machinery, Inc (ACM). To copy otherwise, to republish, to post on servers or to
redistribute to lists, requires specific permission and/or a fee.