Scatter Plot
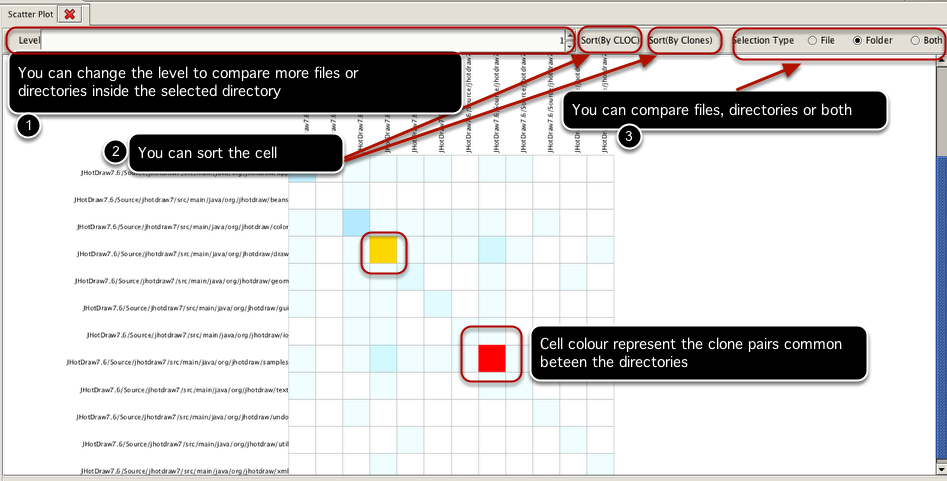
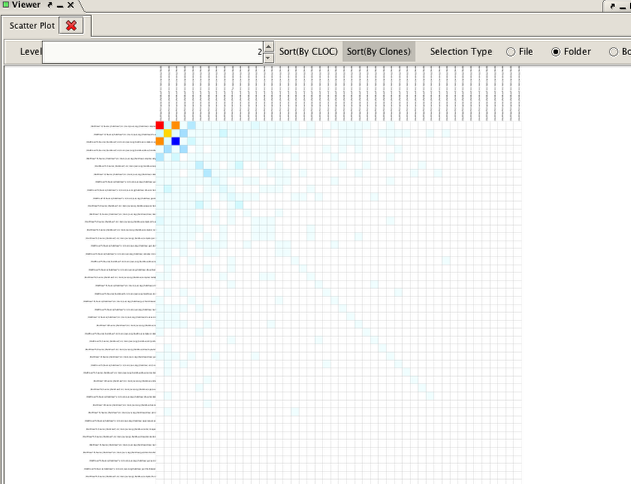
A scatter plot can be viewed as a two dimensional matrix where each cell represents the cloning status between a pair of files or directories. In VisCad, cells render the clone pairs distributed between a pair of files or directories using a color heatmap. Cells are also labelled in the horizontal and vertical axes.
Opening a scatter plot
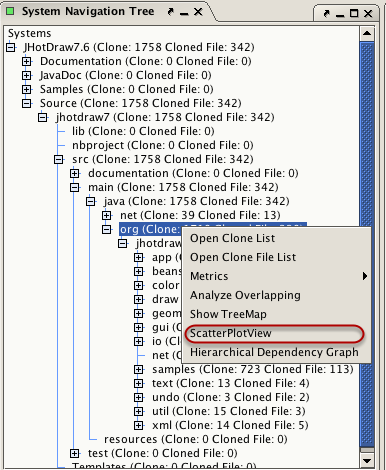
Select a directory from the system navigation tree and right click on it to open a popup menu. Click on the Scatter Plot View menu item.
An example
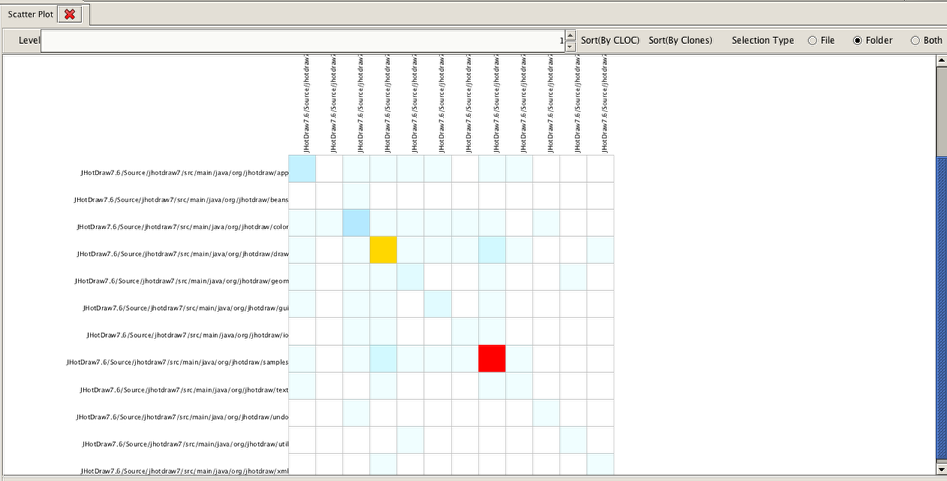
The previous selection opens the above scatter plot on a new tab in the viewer view panel (in the middle of the VisCad user interface).
Options
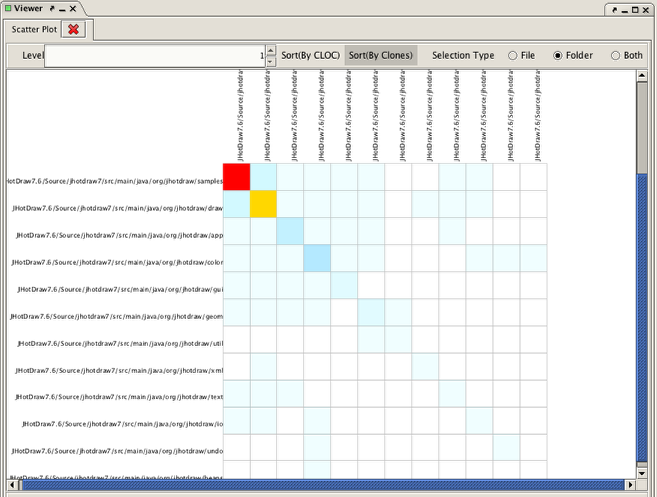
Zoom in or zoom out
You can hold the right mouse button and move it in the inward or outward direction to perform zoom in or zoom out operations. The above figure shows an example of zoom out operation. You can also identify the files or directories involved with a cell with tooltip by holding the mouse pointer on the cell.